 Nov 18, 2025

This post is the first installment of a series where we discuss quality at Powens. In this one, we’ll dive into our anomaly prioritization framework.
Once upon a time, there were bugs
Most engineers would agree that there’s no such thing as a perfect machine – especially in the software industry. Bugs are here and will always be. Software is a complex system, and experience proves Derrick’s theorem every time: the more complex the system, the higher the probability that it fails.
Sure, you can opt for a zero bug policy. That basically means that you don’t ship new code before you’ve solved every bug you’re aware of, even the minor ones. That can work if your software isn’t very complex or has few external dependencies (e.g., the bugs are mostly endogenous and not imported by a piece of software that isn’t yours).
However, from a business perspective, this might be a strategic mistake. Like other industries that require loss-making investments before reaching profitability, software is prone to monopolies – especially when firms reap the benefits of network effects. Today, a handful of big tech stocks account for 30% of the total S&P value. But compared to traditional industries like oil and gas or biopharmaceuticals, the barriers to entry in software are not so high, while the rate of innovation is dramatic. That basically means that a handful of developers with time and talent can very quickly become a life-threatening competitor – especially if your product is fairly commoditized. So if you want to remain the market leader, you need to continuously invest in new products and features.
Now, it seems that Open Banking ticks a few of the boxes mentioned above. It is literally made of external dependencies (connectors to banks’ APIs or websites) and is highly competitive while being fairly commoditized – products from competitors do not differ massively. Network effects and scale matter a lot, since customers will often choose the provider that connects the most banks. And – the icing on the cake – the bank APIs and websites we connect to are not models of stability, to say the least.
So, in theory, Open Banking should have a higher anomaly rate than comparables in the software industry. But as you will see, this is not really the case.
What it means for Powens
Before we start, a side note on terminology: we avoid referring to anomalies as “bugs”, because the vast majority of our issues are imported – they do not result from a quality defect in our code, but they come from an external event in which we do not have any control.
Now that we’re straight with words, let’s talk numbers. Powens currently maintains 5 million live bank connections across Europe and LATAM, while adding between 50K and 100K new ones every month. In a single month, our monitoring system records on average 30K anomalies in all sorts of connections (a single account not refreshed, or a whole bank not available for some users). This gives us an error rate of 0.6% and, conversely, a success rate of 99.4%. That’s a fairly good rate for a product that relies on 1800+ external data sources.
If you group those anomalies by unique root causes, that still leaves around 500 monthly unique issues. That’s approximately 1.2 defects per KLOC – a quality standard in line with most “high-quality” enterprise systems. So in absolute terms, our quality level is high – and even exceptional if you consider that most of our anomalies are imported. But our customers do not reason in absolute terms, and rightly so.
In relative terms, things look different. Our connector maintenance team can fix, on average, 100 anomalies per month. That’s 400 anomalies per month that can’t be fixed – a “bug-fix ratio” of about 20%.
So what do we do about it?
- The first option would be to increase the number of developers working on connector maintenance, at the expense of all the other quality-enhancing work (infrastructure, databases, API model, security, etc). And, of course, at the expense of new features.
- A second option would be to reduce the number of bank connectors we provide: fewer connectors means fewer anomalies. However, we would do that at the expense of usage volume and MRR, since you get rid of successful connections together with unsuccessful ones.
- Option three would be to focus our maintenance resources on anomalies that have a higher impact – either quantitatively (unique anomalies that impact a lot of users) or qualitatively (anomalies that degrade experience the most). Even if that means sometimes taking a view that would be different from some customers’.
Which one would you pick?
Powens’ anomaly prioritization system
Spoiler: We picked all of them. Last year, we set up a new anomaly resolution framework that encompassed all three options in a single, cohesive system. This system lives by 3 rules: (i) align expectations with reality; (ii) focus on impact; (iii) manage chaos.
Align expectations with reality
Aligning expectations with reality means we need to be clear about what we can do and what we can’t, and this clarity must be shared with our customers. Our customers must understand the choices we’re making – especially the difficult ones – and the rationale behind them.
So we first looked at our connectors and clarified the reality: some connectors are more important than others. Main banks, for example. They drive more usage. Other banks, however, are more exotic, like small union banks or new investment platforms.
Also, certain connectors generate more maintenance than others, regardless of how much they’re used. Maybe the bank’s API is less stable, or the website changes often. And, finally, some connectors, even if they’re barely used or generate heavy bug fixing, still have a strategic importance for the company’s growth (for example, we’re launching a new country) or a specific customer segment.
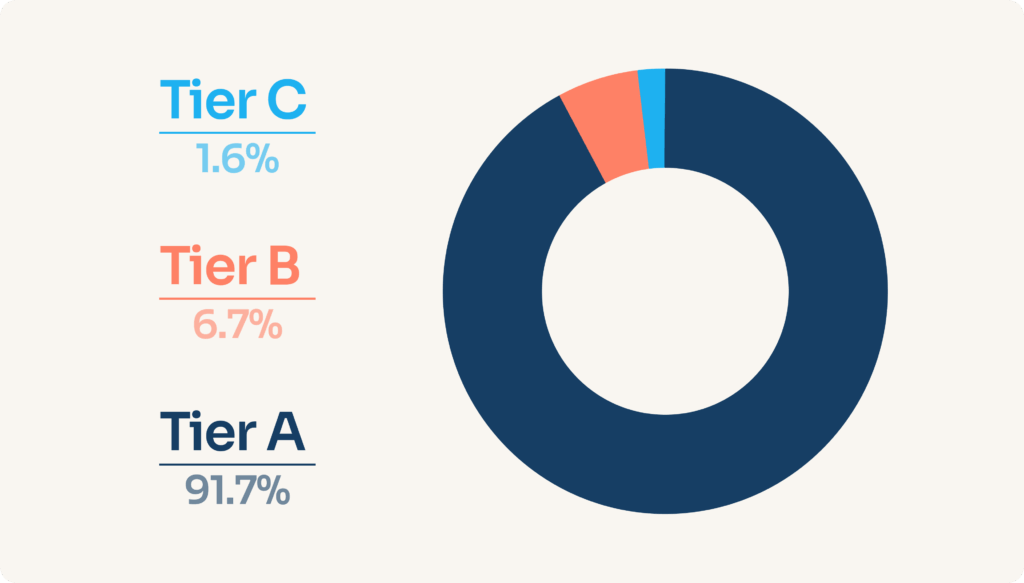
Share of live bank connections per connector Tier
To take account of those different degrees of importance, we designed a Connector Tiering system:
- Tier A for very important connectors
- Tier B for important connectors
- Tier C for less important connectors
The formula we used to attribute a Tier to each of our 1800+ connectors is the product of three factors: usage x maintenance work required x strategic importance.
After we had a balanced system where all of our connectors were attributed a Tier, we could define realistic quality targets for each Tier. We agreed on the single most important quality metric (the new account connection success rate) and we chose to commit to a target number for Tier A and Tier B connectors—but not on Tier C: those would remain best effort. Meaning, we fix when Tier A and Tier B issues are under control.
Of course, it’s difficult for customers to hear that some connectors that are important to them will not benefit from the same care as others. But in the end, this is going to happen anyway. So we prefer to make it clear and transparent. And, besides, more than 90% of our total usage goes through Tier A connectors.
That’s why we share connector Tiers and targets with our customers – so they know what quality level to expect. And it’s not a definitive list. Every quarter, we review our customers’ feedback, look at the historical metrics, and challenge the current connector list. Some are promoted to a higher tier; some are downgraded to a lower one. Some are even deprecated.
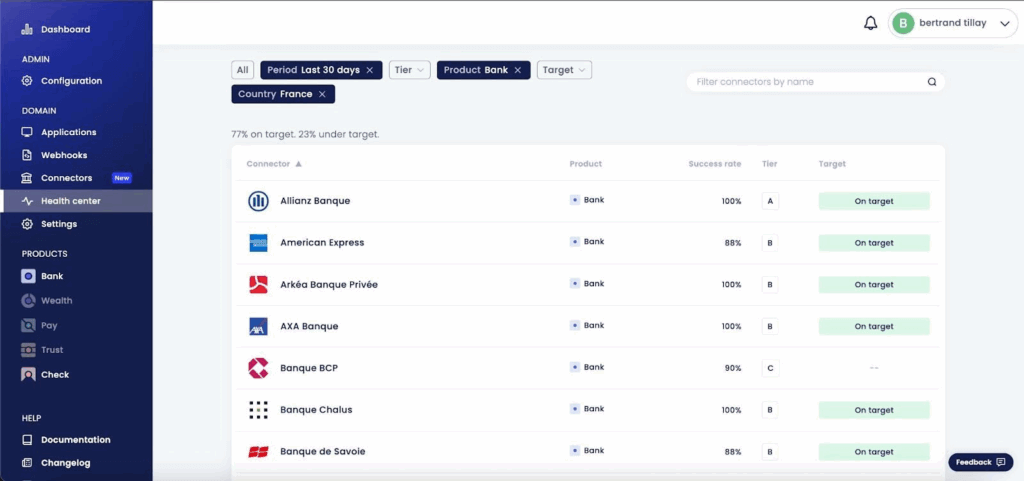
Connector tiers, target levels, and success rates are available on our health dashboard
Again, all of this requires accepting that you cannot physically fix everything you would like to fix. You must make choices, and those choices must be public. So not only do we align our expectations with reality, but we also aim to align our customers’ expectations with reality.
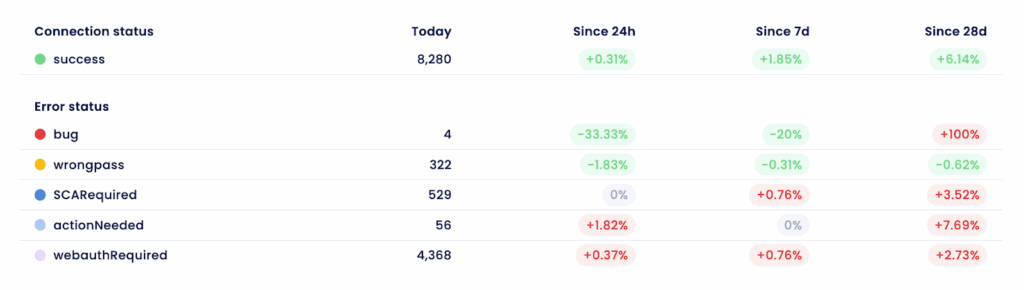
Detailed stats on Powens’ connector success rate and anomaly categories
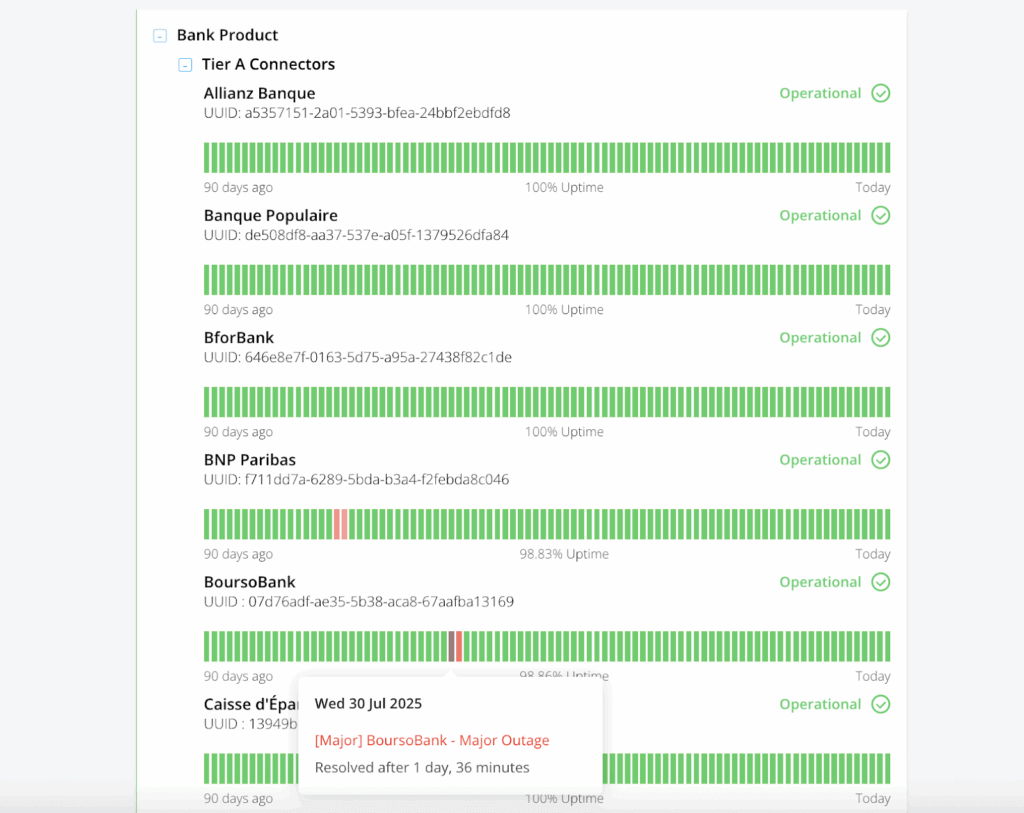
Our public status page provides a historical view of connector success availability
Focus on impact
Connectors are one dimension of the system. Another dimension is the nature of the anomaly (a qualitative factor) and the number of occurrences of this anomaly (the quantitative factor).
Attributing a degree of importance to the number of occurrences of the same anomaly is fairly straightforward: the more occurrences, the higher the importance. An error that interrupts the data refresh for 100K users is more important than an error that interrupts the data refresh of 1,000 users – all things being equal.
Defining how important the kind of anomaly you’re getting is slightly harder because this importance will depend on the customer segment and the value proposition of their app/software. Broadly speaking, we classify anomalies in three big buckets:
- A “new account fail” (which is the failure for a user to add an account for the first time)
- A “refresh account fail” (failure to refresh the data for an account that’s already connected), and
- A “data quality issue” (some of the data retrieved is incorrect).
The order of importance we decided on is “new account fail” > “refresh account fail” > “data quality issue”.
Now let’s mix it all together. There are the easy cases. Say that a Tier A connector has a problem that prevents all users from adding new accounts – this connector accounts for 15% of our total traffic. No one is going to argue whether we should attribute a high priority to this issue.
Let’s say that you have to decide which to fix first:
- A 100% crash of a Tier B connector, which accounts for 2% of our total traffic
- 30% of users of a Tier A connector who cannot refresh their data anymore (and that’s 4% of your total traffic)
Not so easy anymore.
That’s why we built a decision matrix, which delivers priority numbers from p0 (most important) to p25 (least important) for all possible kinds of issues. The number series is sequential – you can’t have two types of anomaly that both have p5 priorities.
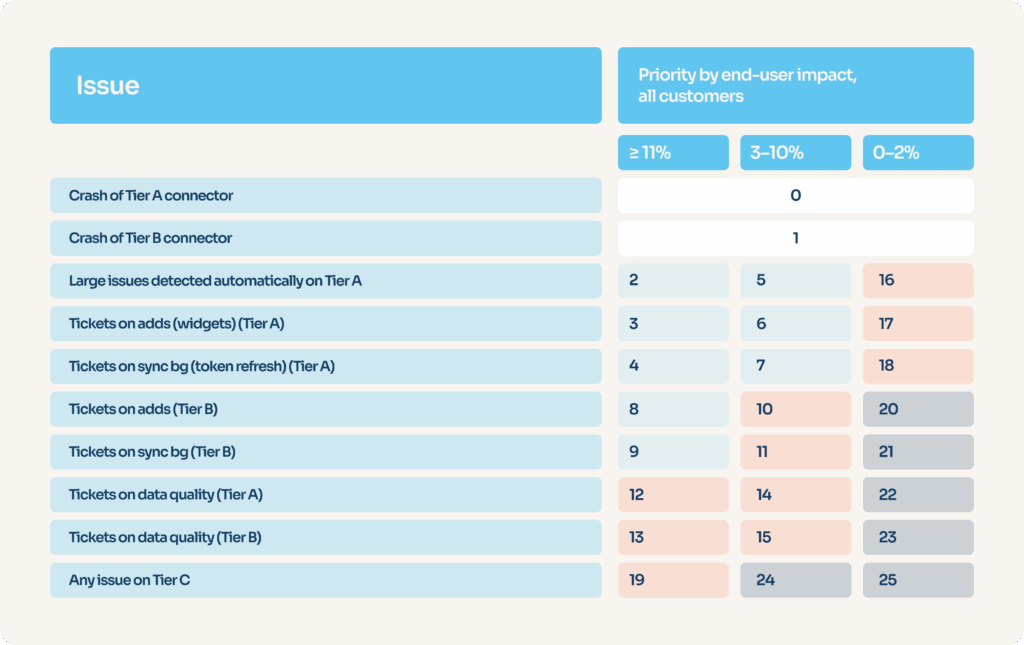
Our monitoring tooling can automatically compute end-user impact and determine the nature of the anomaly concerned by parsing stack traces (error logs). A raw priority is set automatically, which can then be manually overridden by the connector maintenance team.
Manage chaos
Now, all this is fine and dandy – but how can we adapt to issues that arise erratically? And when can you decide to actually not fix an anomaly rather than keep it for later? Some months, we have multiple “p0”s at the same time (big connector crashes). Other months, we barely have a p2. And how do we balance connector bug fixing with longer-term tasks – like improving the monitoring system, for example? Development work that’s interrupted randomly will go nowhere, and you might end up with under-investing in your platform, which will eventually generate more instability.
You need, again, a system that’s flexible enough to increase resources tactically (the number of developers available to fix connector bugs) but rigid enough to avoid interrupting longer-term quality-enhancing work that would otherwise be interrupted as soon as things start to heat up.
To that end, we decided to sort all priority numbers into four categories: “critical”, “high”, “medium”, and “low”. Depending on the priority category, the product lead of the connector maintenance team has either more or less firepower.
Amongst the powers they can use are: declining a task (choosing not to fix, ever); interrupting any kind of other development task, including long-term); or even, in the most critical cases, requesting the assistance of any developer from the company, in any team, until the problem is fixed.
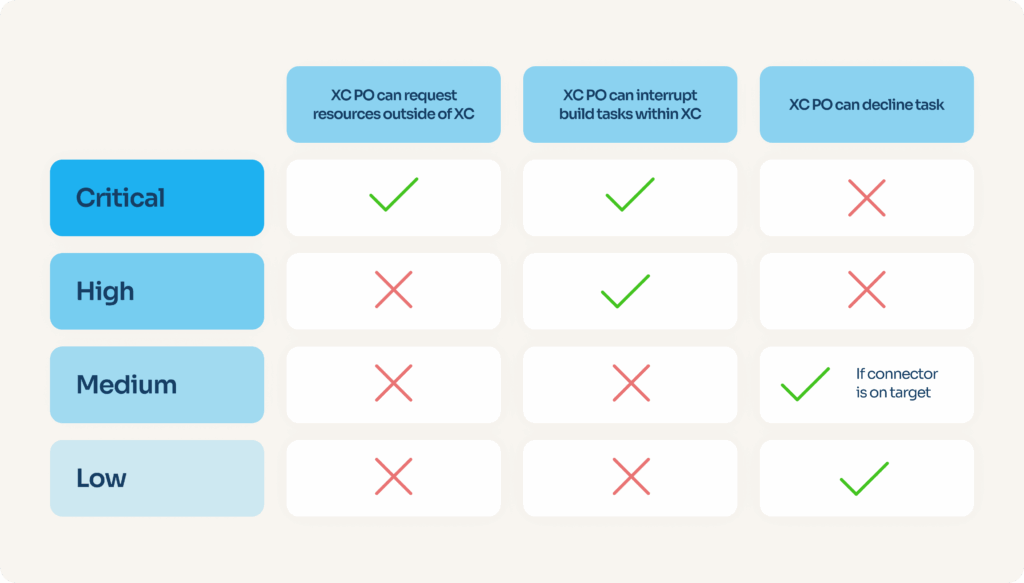
“XC” means “X-Connectors”, the team responsible for connectivity. “PO” means “Product Owner”, the role responsible for making product decisions in the team.
Conclusion
There’s a lot of competition in Open Banking, and Powens has been taking a strong lead for quite some time now. One of the reasons for this is our commitment to quality and customer care. For many of our customers, the services we provide are mission-critical. Their tolerance for anomalies is low – and rightly so. It is our duty to be transparent and do everything possible to live up to their expectations.
Our tiering and prioritization system is just one of the many initiatives that’s moving in that direction. We can’t wait to share the others with you, so stay tuned.